![]()
Building Podish: An iOS-optimized Linux x86 container (that happens to be faster than iSH)
TL;DR:
Podishis a high-performance Linux x86 user-space container optimized specifically for iOS and Apple Silicon. I wrote an i686 interpreter core in C++ and a Linux compatibility layer in C#. On an iPhone 17 (A19), it scores ~3400 on CoreMark, which is about twice as fast as iSH.Web Demo: https://podish.meokit.com
GitHub: https://github.com/meokit/podish
Project Overview
Podish’s goal is simple: run x86 Linux programs as efficiently as possible on JIT-restricted iOS. It is not a full-system emulator (like UTM), but a user-space container — similar to iSH, but written completely from scratch, and roughly twice as fast across multiple dimensions.
What It Can Run
| Category | Representative Program | Status |
|---|---|---|
| Shell / Base Userland | busybox / bash / vim | Stable |
| Scripting Runtime | python3 / LuaJIT | Verified; stable benchmarks |
| Build Toolchain | gcc / make | Verified; make compile works |
| Network / Dev Tools | git / OpenSSH | Manually verified; git clone works |
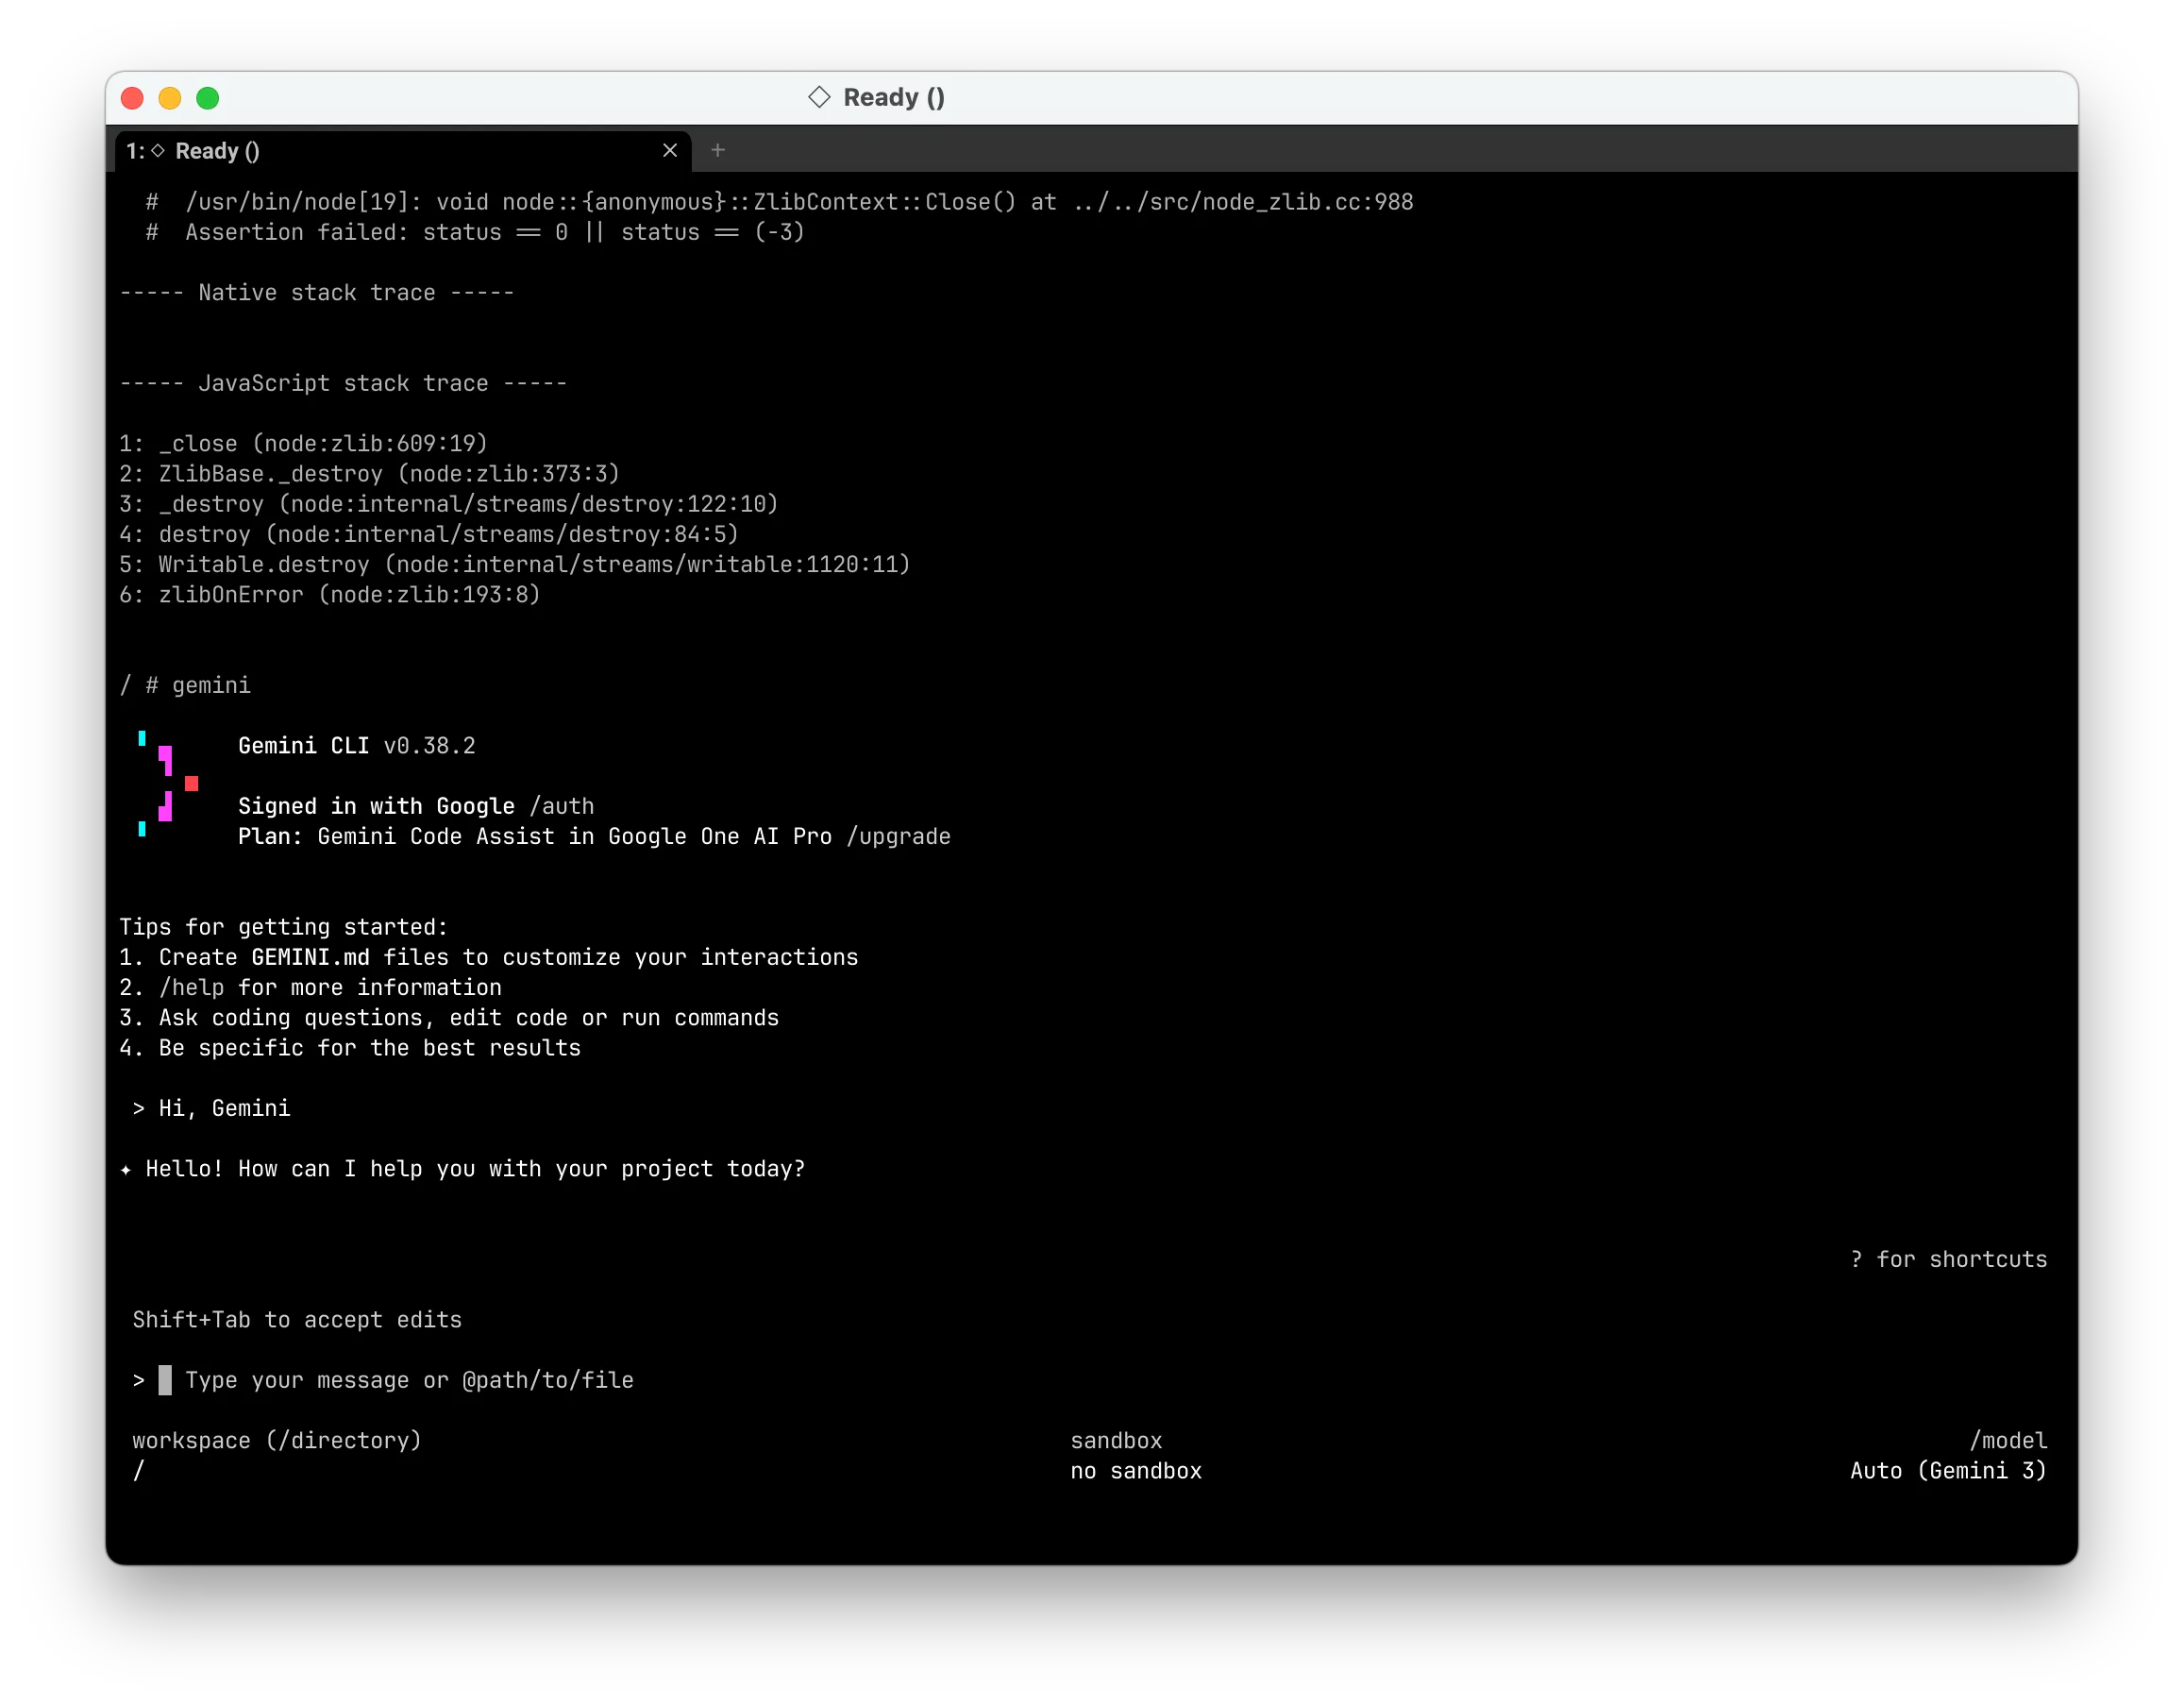
| Heavy Runtime | Node.js / Gemini CLI | Boots; occasional crashes (V8 JIT related) |
Screenshots
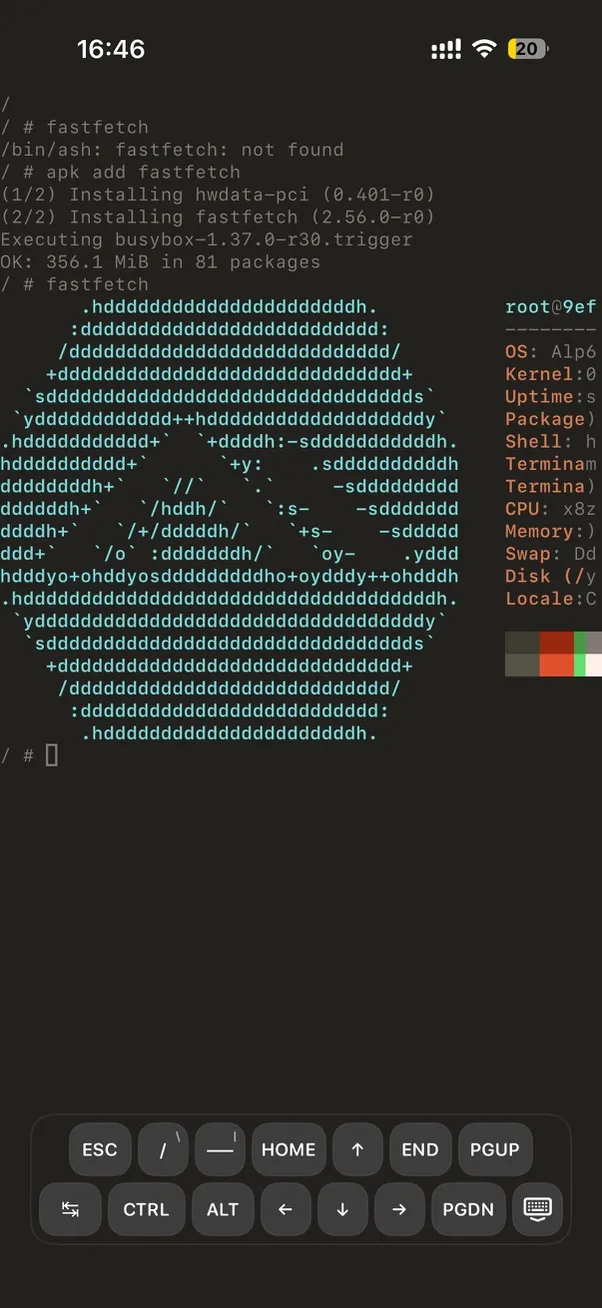
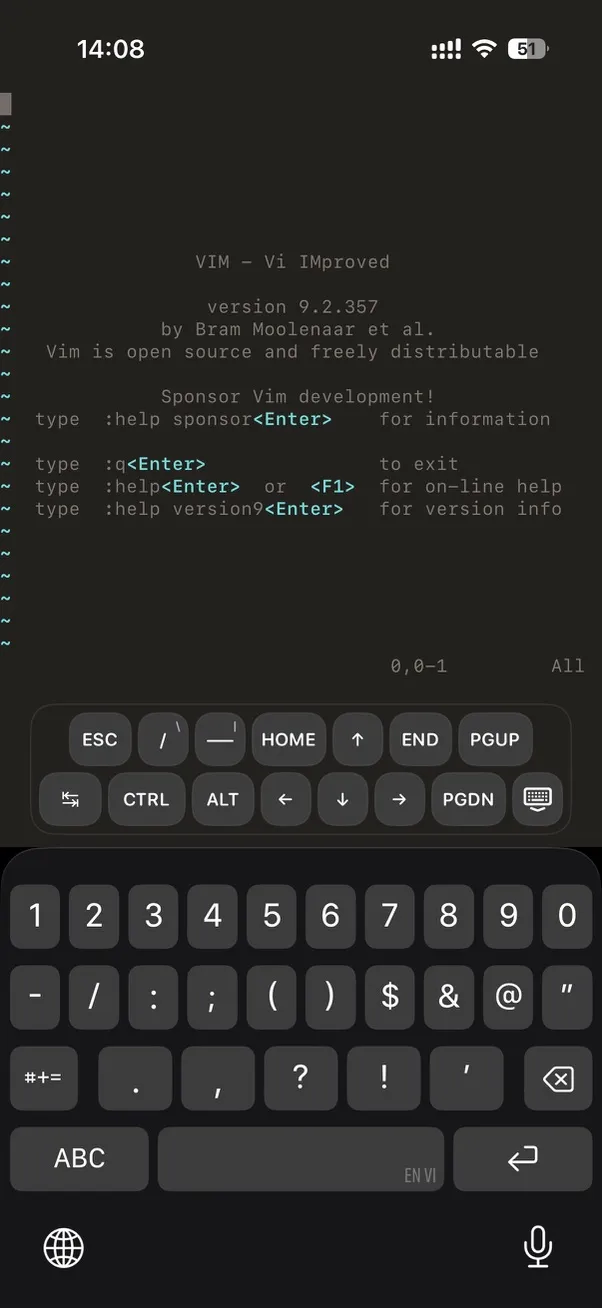
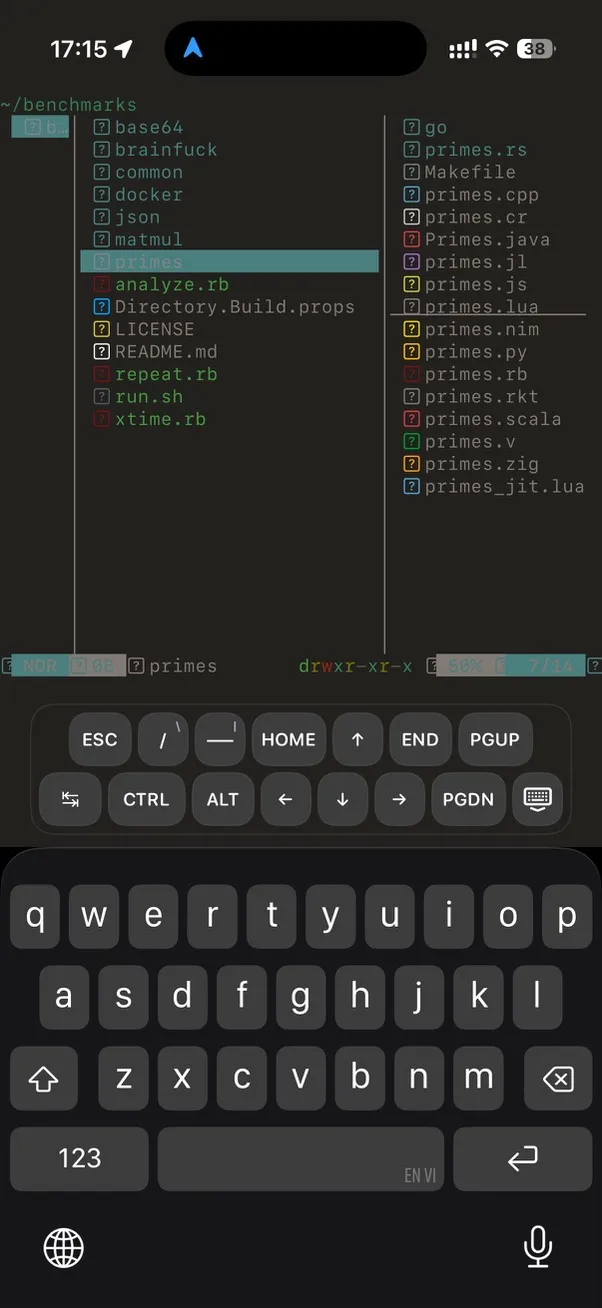
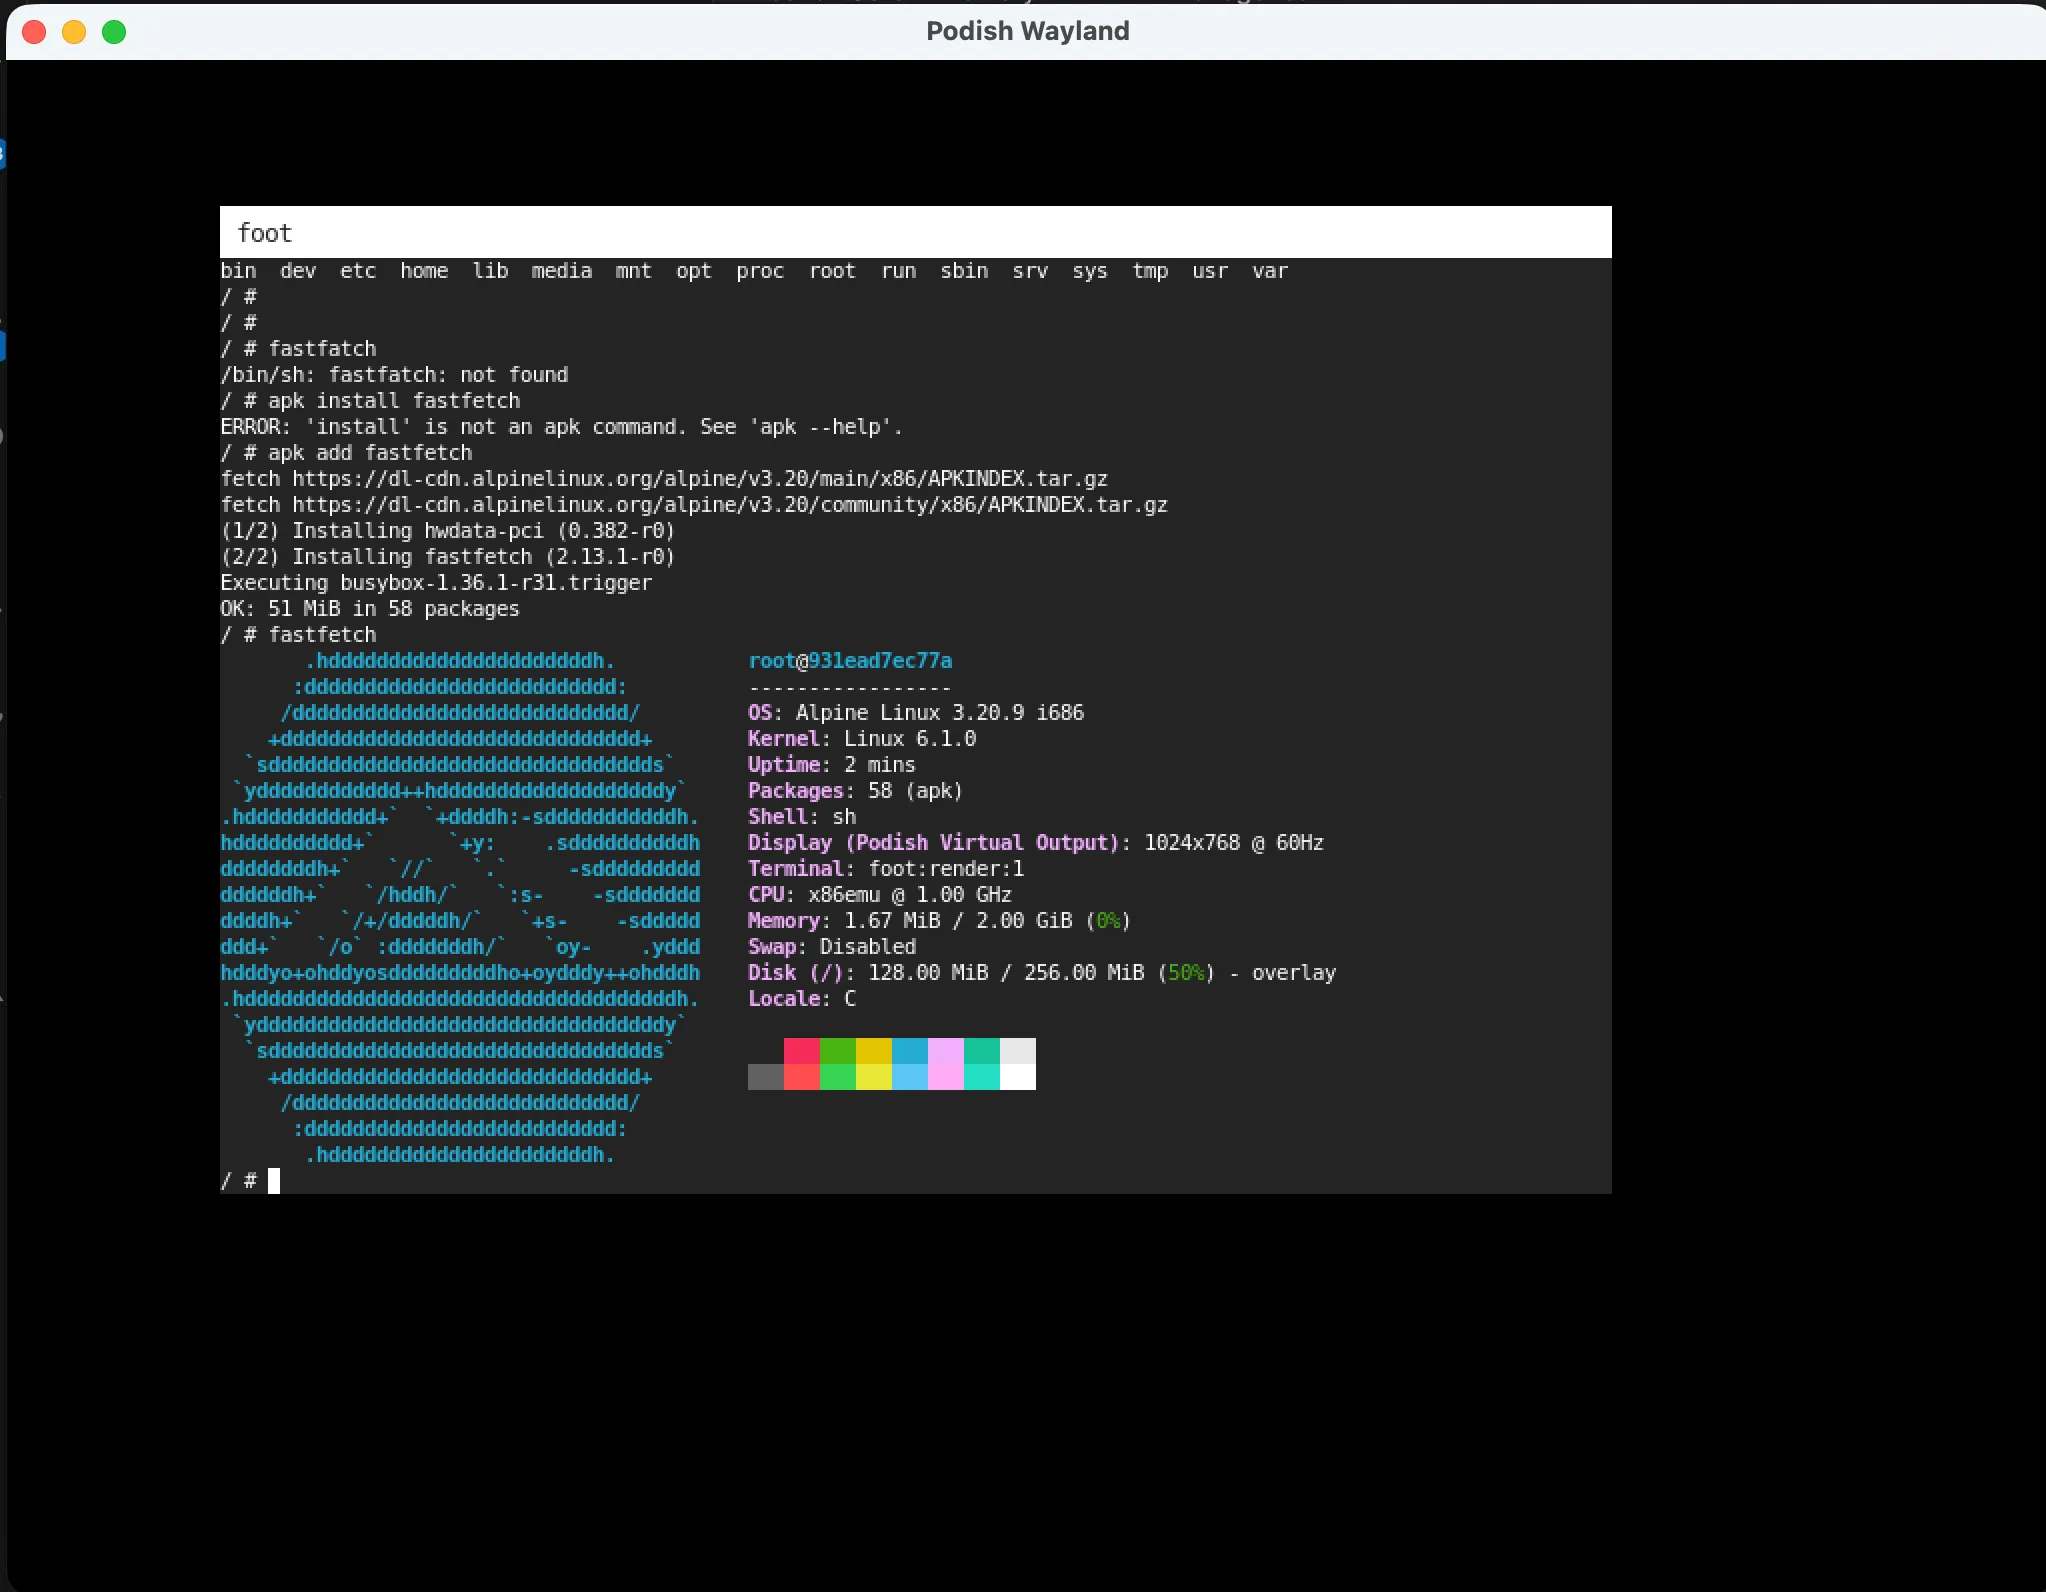
Terminal environment on iPhone:
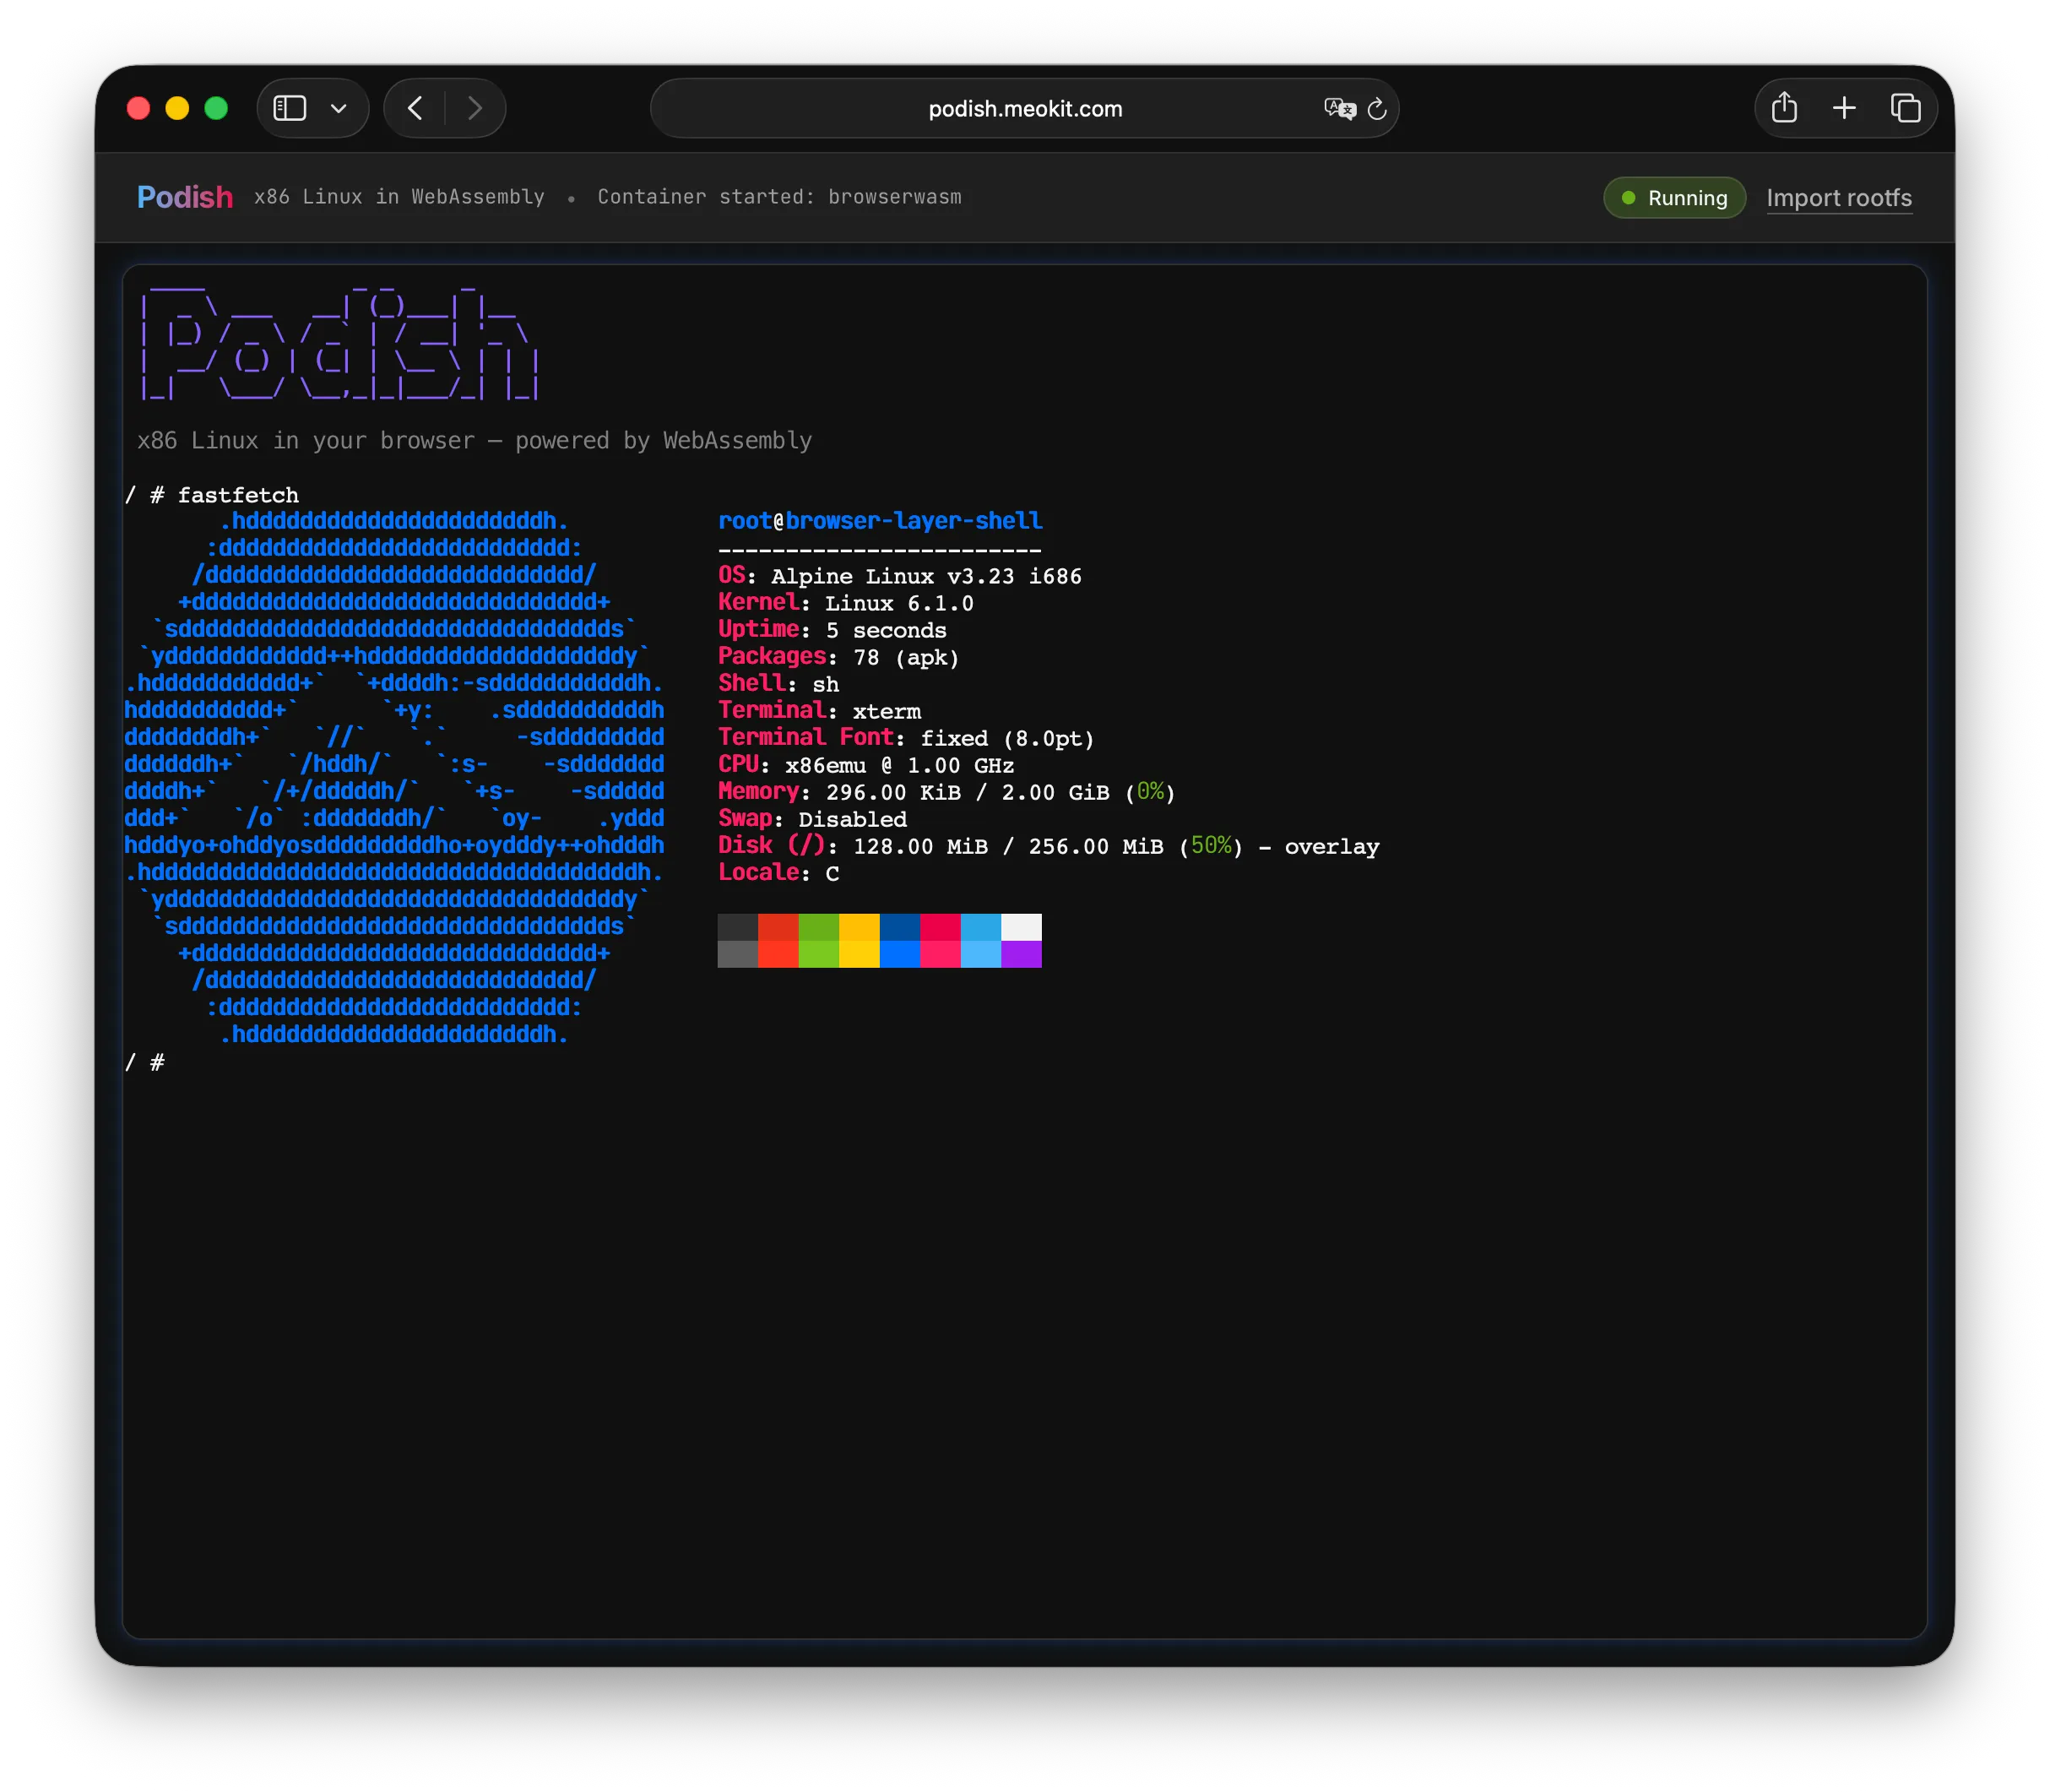
Browser Demo (no installation needed):
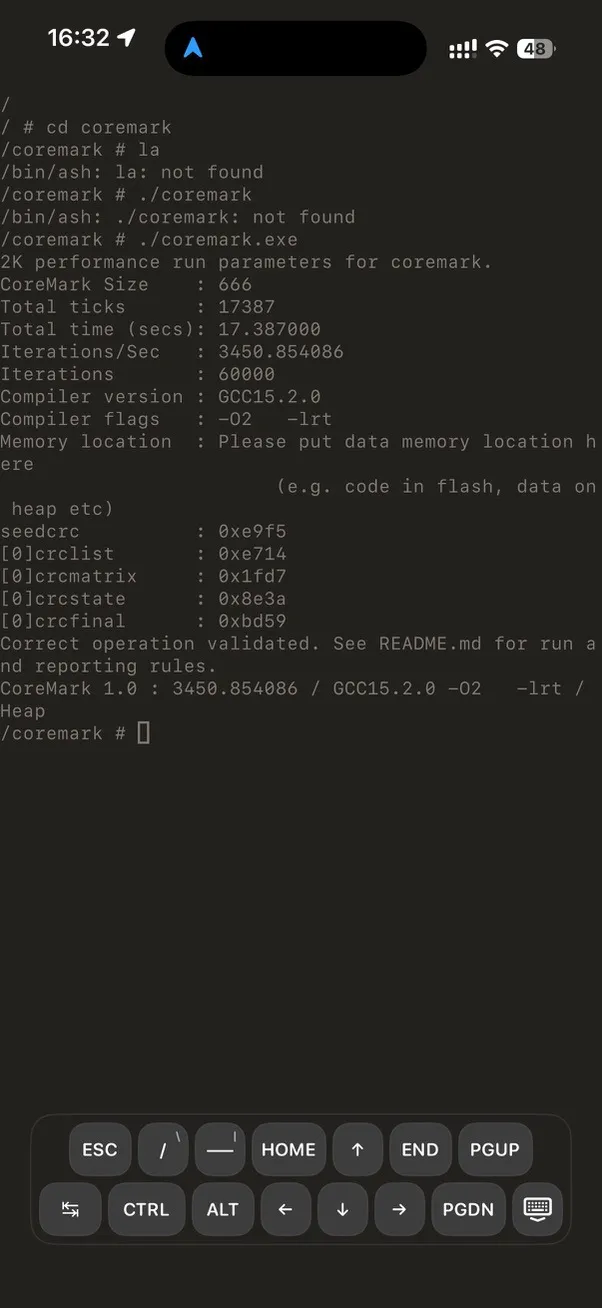
CoreMark on iPhone:
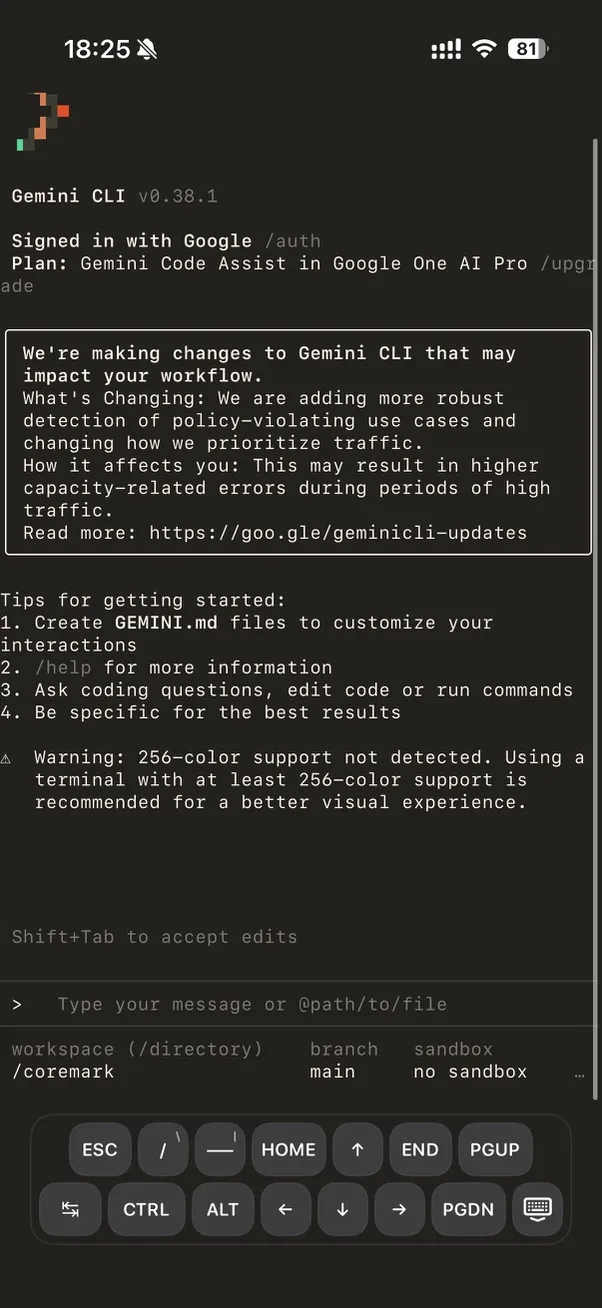
Running Gemini CLI:
Performance at a Glance
| Workload | Podish (A19) | iSH (A19) | Speedup |
|---|---|---|---|
| CoreMark 1.0 | 3447 | 1692 | ~2.0× |
python primes.py | 78.3 s | 684.4 s | ~8.7× |
luajit -joff primes | 14.5 s | 27.5 s | ~1.9× |
sh -lc true warm start | 20 ms | 30 ms | ~1.5× |
Full benchmarks and testing environment details are at the end in “Performance Data & Optimization Journey”.
The following sections dive into technical implementation details. If you only want to know the project’s current state, the overview above is sufficient. If you want to see how the interpreter gets this fast, keep reading.
Motivation & Background
iOS has a famous restriction: no JIT compilation. Specifically, the system prohibits WX (Write-XOR-Execute) memory page mappings; unsigned code cannot execute. This means you cannot download a JIT-accelerated UTM from the App Store — only the painfully slow UTM SE. You also cannot run LuaJIT in JIT mode.
My question: Just how fast can an interpreter get? Can a carefully designed, hardware-aware interpreter rival JIT performance without using JIT at all?
The main inspiration for the interpreter was LuaJIT Remake. Through it, I learned about Clang’s preserve_none, preserve_all, and [[musttail]] ABI features — tools that might let the compiler generate interpreter hot paths comparable to hand-written assembly.
The project started with hello world (week one), got CoreMark running (about a month later), and now stably runs Busybox, Bash, Python, LuaJIT, GCC, and even boots Node.js and Gemini CLI.
Overall Architecture
Podish is not a monolithic design; it has clear layers:
flowchart TB
    subgraph Guest["Guest x86 Linux Binary"]
        A["i686 ELF / libc / app"]
    end

    subgraph Core["Emulation Core (C++)"]
        B["Predecode / Block Builder"]
        C["Interpreter Dispatch + Semantics"]
        D["MMU / MicroTLB / SoftTLB"]
    end

    subgraph Runtime["Linux Runtime (C#)"]
        E["Syscall Layer"]
        F["VFS / Process / Signal / Network"]
        G["Netstack (smoltcp)"]
    end

    subgraph Orchestration["Container Layer (C#)"]
        H["Podish.Core / OCI"]
        I["Podish.Cli"]
    end

    subgraph Host["Host Platform"]
        J["iOS / macOS / Browser"]
        K["SwiftUI / SDL"]
    end

    A --> B
    B --> C
    C --> D
    D --> E
    E --> F
    F --> G
    F --> H
    H --> I
    I --> J
    J --> K
%%endmermaid
The repository is roughly organized into these layers:
libfibercpu: IA-32 emulator core written in C++Fiberish.Core: Linux runtime / kernel compatibility layerFiberish.Netstack: Based on smoltcpPodish.Core: Higher-level container/runtime orchestrationPodish.Cli: CLI for actual usage- SwiftUI / Browser interfaces
Why C++ for the core and C# for the runtime?
This is a deliberate engineering trade-off.
Why C#? Early on, I needed to rapidly implement the semantics for about 200 Linux syscalls, a VFS layer, a network stack, and container lifecycle management. C#‘s cross-platform I/O, string handling, async model, and rich standard library allowed me to push from “hello world” to a running CoreMark in just a month. If I had used pure C++, I’d probably still be writing wrappers for std::filesystem.
Controlling boundary overhead: To prevent P/Invoke from becoming a bottleneck, I made a few key design choices:
- Minimal C API:
libfibercpuexposes a strictly C-style API (X86_Create,X86_Run,X86_RegRead, etc.), which C# calls viaLibraryImport/DllImport. TheEmuStateis just anIntPtron the C# side, creating zero GC pressure. - Zero-copy memory access: The C# layer never reads/writes guest memory byte-by-byte through P/Invoke. Instead,
bindings.hprovidesX86_ResolvePtrForRead/Writereturning a raw host pointer, which C# maps usingSpan<byte>orMemoryMarshalto manipulate directly. - Anchoring Callbacks: Callbacks into C# (Fault, Interrupt, Log) need to hold a reference to the C#
Engineobject. I pin the object on the heap usingGCHandle.Alloc(this)and pass the pointer to C++ asuserdata, completely avoiding GC relocation issues across the boundary. - Batching Syscalls: In the hot path, the guest program usually executes hundreds or thousands of instructions in C++ before triggering a single syscall. The actual frequency of boundary crossings depends on the guest’s syscall density, not its instruction density.
Profiling shows that in compute-heavy workloads (like CoreMark), language boundary overhead accounts for less than 1%. In I/O-heavy workloads (like git clone), the bottlenecks are the network and VFS, not P/Invoke.
Interpreter Core: Four Key Design Decisions
The core goal of the interpreter is: push the overhead of x86 emulation as low as possible without using JIT. Here are the four most critical design decisions.
1. Pre-decoding + Tail-call Dispatch
Traditional interpreters usually have a central dispatch loop (while (1) { decode; dispatch; execute; }), returning to the loop after every instruction. My approach shifts dispatch forward:
flowchart LR
    A["x86 Binary"]
    B["BasicBlock"]
    C["Handler: mov"]
    D["Handler: add"]
    E["Handler: jmp"]
    Ret["Return to X86_Run"]
    A -->|Predecode| B
    B -->|Entry| C
    C -->|musttail call| D
    D -->|musttail call| E
    E -->|Block end| Ret
%%endmermaid
Specifically:
- Pre-decode: Variable-length x86 instructions are decoded into a fixed-length Intermediate Representation (
DecodedOp, 32 bytes), stored sequentially in a Basic Block. - Tail-call chain: Each IR carries its own handler function pointer. After executing the current instruction, instead of returning to a central dispatcher, it directly tail-calls into the next instruction’s handler via
[[musttail]]. - Caching: Decoded results are cached in
BasicBlock, avoiding repeated decode.
The result: roughly 10× faster than QEMU TCI. (A big shoutout to Justine Tunney’s blink project, which introduced me to Intel’s XED and helped me build the table-driven decoder).
DecodedOp is fixed at 32 bytes, aligned to a 16-byte boundary:
| Field | Type | Offset | Size | Description |
|---|---|---|---|---|
handler | HandlerFunc* (function pointer) | 0 | 8 | Entry point for the instruction’s semantics |
next_eip | uint32_t | 8 | 4 | PC of the next instruction |
len | uint8_t | 12 | 1 | Instruction byte length |
modrm | uint8_t | 13 | 1 | ModRM byte |
prefixes | Prefixes (union with bitfields) | 14 | 1 | Prefix info (lock/rep/segment…) |
meta | Meta (union with bitfields) | 15 | 1 | Meta info (has_mem / has_imm / ext_kind…) |
ext.data | DecodedMemData | 16 | 16 | Memory operand description (imm / ea_desc / disp) |
ext.link.next_block | BasicBlock* | 24 | 8 | Cached successor block pointer after block linking |
ext.control | DecodedControlFlowData | 16 | 16 | Control-flow target (target_eip / cached_target) |
If we take a simple memory ALU instruction as an example:
Guest:
  add eax, [ebx+4]

Predecoded IR:
  entry      = op_add_r32_rm32
  next_pc    = 0x...
  operands   = { dst=eax, src=mem(base=ebx, disp=4, size=4) }
  flags_mode = arithmetic
  control    = fallthrough
2. Parity-Only Lazy Flags
Implementing x86 EFLAGS accurately is tedious. QEMU uses a very elegant lazy evaluation system where they store CC_SRC, CC_DST, and CC_OP, only calculating the flags when explicitly requested.
I tried implementing this, and it was slower than calculating them eagerly. Why? Because writing those three variables to memory and reading them back was killing me — I was already memory-bound.
My compromise: I only evaluate the Parity Flag (PF) lazily.
flowchart TB
    A["ALU Instruction"] --> B{"Writes Flags?"}
    B -->|Yes| C["Update CF/ZF/SF/OF/AF/DF in flags_cache[31:0]"]
    C --> D["SetParityState: store result byte to flags_cache[47:40]"]
    B -->|No| E["Skip flags update"]

    F["jcc / cmov / setcc"] --> G{"Cond depends on PF?"}
    G -->|No| H["Read flags_cache[31:0] directly"]
    G -->|Yes| I["EvaluatePF: compute parity from flags_cache[47:40]"]
%%endmermaid
During execution, flags_cache is a uint64_t passed through the tail-call chain:
- Lower 32 bits: real-time architectural EFLAGS (CF/ZF/SF/OF/AF/DF maintained in real time)
- Upper bits (bits 40-47): PF lazy state (stores the source byte, not the PF bit itself)
Why only lazy PF? CF/ZF/SF/OF are written by almost every ALU instruction and read by almost every jcc/cmov/setcc. Doing them lazily adds memory overhead that isn’t worth it. But PF is expensive to calculate (requires iterating bits) and rarely used (only by JP/JNP, cond 10/11), so it’s worth lazying.
Static layer: Within a basic block, I do def-use analysis on flags. If an instruction writes flags but no one reads them later, it is replaced directly with a no-flags handler variant. This variant is expressed through template parameters like AluAdd<T, false> and AluSub<T, false>; the compiler completely elides the entire flags-update path.
Dynamic layer: During execution of each instruction, flags_cache is passed as a register argument through the tail-call chain and is never written back to memory. Only PF is lazy:
- When writing PF,
SetParityState(flags_cache, result_byte)stuffs the low 8 bits of the result directly into the high parity state bits without calculating parity; - When reading PF,
EvaluatePF(flags_cache)retrieves the source byte from the high bits and calculates parity on the spot; - At externally visible points (
pushf,lahf, faults, interrupts, API boundaries),GetArchitecturalEflags()materializes the lazy parity and returns the full 32-bit EFLAGS.
Commit semantics: CommitFlagsCache is only called once at handler chain exit boundaries (ExitOnCurrentEIP, ExitOnNextEIP, restart/retry, resolver miss), writing the register-held flags_cache back to state->ctx.flags_state. During successful chaining it is never committed — because the next instruction’s handler will continue passing the same flags_cache as a register argument. X86_Run() and X86_Step() also do not commit after the handler returns, to avoid overwriting updated state with a stale caller-side copy.
An interesting detail is the CheckCondition LUT path: the vast majority of conditional jumps (cond 0-9, 12-15) do not depend on PF, so they read the low 32 bits via GetFlags32Raw(flags_cache) and use a LUT lookup to decide the branch direction; only cond 10/11 (JP/JNP) branch separately to EvaluatePF(). This design makes the extra cost of PF laziness nearly zero.
3. Memory Access is the Real Bottleneck: MicroTLB and SoftTLB
I spent so much time analyzing dispatch overhead, only to realize during profiling that my biggest issue was shockingly basic: address translation.
flowchart LR
    A["Guest Address"] --> B{"MicroTLB Hit?"}
    B -->|Yes| C
    B -->|No| D{"SoftTLB Hit?"}
    D -->|Yes| E
    D -->|No| F
    F --> G
    G --> E
    E --> C
    C["host_ptr = guest_addr + addend"]
    E["Refill MicroTLB"]
    F["Page Table Walk"]
    G["Permission Check"]
%%endmermaid
SoftTLB is a three-way direct-mapped TLB consisting of three fixed-size tables:
| Field | Type | Offset | Size | Description |
|---|---|---|---|---|
read_tlb | std::array<TlbEntry, 256> | 0 | 4096 | Fast read-permission mapping table |
write_tlb | std::array<TlbEntry, 256> | 4096 | 4096 | Fast write-permission mapping table |
exec_tlb | std::array<TlbEntry, 256> | 8192 | 4096 | Fast execute-permission mapping table |
TlbEntry is aligned to 16 bytes, fixed at 16 bytes:
| Field | Type | Offset | Size | Description |
|---|---|---|---|---|
tag | uint32_t | 0 | 4 | Guest page tag (high 20 bits) |
perm | Property (enum) | 4 | 4 | Permission bits (Read / Write / Exec / Dirty …) |
addend | std::uintptr_t | 8 | 8 | host_ptr = guest_addr + addend |
Indexing is also very direct:
idx = (guest_addr >> PAGE_SHIFT) & 255
tag = guest_addr & ~PAGE_MASK
host_ptr = guest_addr + addend
In other words, SoftTLB’s job is to compress already-looked-up guest page mappings into a fast tag + addend entry. On a hit, you just check the tag and do one addition to get the host address; on a miss, you fall back to the slow path to check permissions, fill the entry, and handle exceptions.
It turned out to be a very silly TLB refill bug. Fixing it immediately bumped my CoreMark from 600 to 800. It made me realize: Address translation is the true bottleneck.
I introduced a MicroTLB — a tiny 16-byte structure kept permanently in a host register during the execution chain. If it hits, it’s just a quick tag match and an addition (host_ptr = guest_addr + addend).
MicroTLB is a resident register structure, aligned to 16 bytes, fixed at 16 bytes:
| Field | Type | Offset | Size | Description |
|---|---|---|---|---|
tag_r | uint32_t | 0 | 4 | Read-permission tag, default 0xFFFFFFFF (miss state) |
tag_w | uint32_t | 4 | 4 | Write-permission tag, default 0xFFFFFFFF (miss state) |
addend | std::uintptr_t | 8 | 8 | host_ptr = guest_addr + addend |
Note the data layout: read_tag + write_tag are merged into the same register, so this structure occupies two host registers.
Its hit/miss path can be represented as:
guest address
  -> check read_tag / write_tag
  -> hit: host_ptr = guest_addr + host_guest_addend
  -> miss: full translation + permission check + refill MicroTLB
During refill, permissions are checked; if there is no read permission, read_tag is cleared, and vice versa.
This design may seem odd — if reads and writes repeatedly hit different pages, the MicroTLB will ping-pong and the hit rate drops to zero.
But most of the time it works. My measurements show a hit rate above 50%. As long as there is some hit rate, reducing the frequency of reads from the in-memory SoftTLB provides a performance boost.
4. Block Linking and Superopcodes
In this interpreter, BasicBlock is an object with a fixed-size header followed by a variable-length instruction stream. Its header looks roughly like this:
BasicBlock is aligned to 16 bytes; the header is fixed at 48 bytes, followed by a variable-length DecodedOp array:
| Field | Type | Offset | Size | Description |
|---|---|---|---|---|
chain.start_eip | uint64_t (bitfield: 32 bits) | 0 | 4 (embedded in BasicBlockChainPrefix) | Block start guest PC |
chain.inst_count | uint64_t (bitfield: 8 bits) | 4 | 1 | Number of instructions in the block |
chain.valid | uint64_t (bitfield: 1 bit) | 5 | 1 bit | Whether the block is valid (for invalidation marking) |
entry | HandlerFunc* | 8 | 8 | Semantic entry point of the first instruction; the interpreter jumps here directly |
end_eip | uint32_t | 16 | 4 | Block end address (next_eip of the last instruction) |
slot_count | uint32_t | 20 | 4 | Total slot count (including trailing sentinel) |
sentinel_slot_index | uint32_t | 24 | 4 | Index of the sentinel in the slots array |
branch_target_eip | uint32_t | 28 | 4 | Branch target address (valid for conditional/direct jumps) |
fallthrough_eip | uint32_t | 32 | 4 | Fallthrough address |
terminal_kind_raw | uint8_t | 36 | 1 | Terminal kind (None / DirectJmpRel / DirectJccRel / Other) |
block_padding0 | uint8_t | 37 | 1 | Padding |
block_padding1 | uint16_t | 38 | 2 | Padding |
exec_count | uint64_t | 40 | 8 | Number of times the block has been executed (for profile-guided superopcode) |
slots[] | DecodedOp[] | 48 | Variable (32 bytes each) | Pre-decoded instruction stream |
A few fields are especially critical:
entrypoints to the first executable semantic entry of this block; once the interpreter has the block, it can start running from here directly.slots[]is a sequentially orderedDecodedOparray, eachDecodedOpfixed at32bytes.slot_countincludes the trailing sentinel, so the block’s memory layout is a fixed header plus a contiguous op stream.branch_target_eip/fallthrough_eiplet block linking know successor destinations at the block level ahead of time.exec_countis important input for profile-guided superopcode generation.
DecodedOp itself is not a minimal “handler-pointer-only” structure. Beyond handler and next_eip, it also stores memory operand info, control-flow targets, or the next_block pointer cached after block linking in its extension area.
So what BasicBlock really does is bind three things together:
- Caching pre-decode results to avoid repeated decoding
- Placing a sequence of
DecodedOps compactly into a tail-callable execution stream - Providing a stable carrier for subsequent optimizations like block linking, superopcode, and profiling
When I later implemented block linking, I stitched and reused directly on top of the existing BasicBlock.
flowchart LR
    A["Block A"] -->|"fallthrough"| B["Block B"]
    A -->|"branch taken"| C["Block C"]

    D["Superopcode"] -->|"fused"| E["pop ebx ; pop esi"]
    D -->|"fused"| F["test eax, eax ; je"]
    D -->|"fused"| G["mov eax, [esp] ; sub reg, eax"]
%%endmermaid
Block Linking: If a basic block is short enough, its instructions don’t cross page boundaries, and its control flow is simple, the successor block is stitched directly to the end of the current block. This reduces some indirect memory access during inter-block jumps.
Superopcode: At first I tried simple bigram statistics, but the results were mediocre. The reason is obvious: high-frequency bigrams aren’t necessarily frequently executed — they just have high frequency among all pairs, and the total number of fixed instruction pairs isn’t large to begin with. Additionally, because we do instruction specialization, the specialized instructions become extremely sparse, making even fewer pairs fixable.
The more effective approach is:
- First select seeds around high-frequency anchor instructions
- Then examine their def-use relationship with neighboring instructions
- Only fuse combinations with
RAW(Read-After-Write) dependencies
This strategy ultimately generated about 256 superopcodes, and was one of the key steps in stably pushing performance past 3000+ CoreMark.
Representative examples in the current generation set include:
- Stack-operation chains:
pop ebx ; pop esi - Flags producer/consumer chains:
test eax, eax ; je/jz ... - Load-use chains:
mov eax, [esp+off] ; sub reg, eax - Load-store chains:
mov ebx, [esp+off] ; mov [esi], ebx
The candidate discovery pipeline is essentially not complicated:
block trace
  -> hotspot statistics
  -> anchor selection
  -> def-use / RAW filtering
  -> code generation
  -> regression verification and benefit review
SMC (Self-Modifying Code) Handling
SMC (Self-Modifying Code) is standard in modern JIT engines (V8, LuaJIT, .NET JIT): they write machine code to memory and immediately jump to it. The emulator must handle this correctly.
My approach is not “monitor every write operation globally,” but rather reuse the MMU’s permission system, pushing detection costs into permission bits:
flowchart TB
    A["mmap/mprotect\nPROT_EXEC | PROT_WRITE"] --> B["Register External Alias"]
    B --> C{"Live BasicBlock\non this page?"}
    C -->|Yes| D["Set ForceWriteSlow\non guest page entries"]
    C -->|No| E["Normal page"]

    F["Guest Write Instruction"] --> G{"ForceWriteSlow?"}
    G -->|Yes| H["invalidate_code_cache_page"]
    H --> I["Mark blocks invalid"]
    G -->|No| J["Fast write path"]
%%endmermaid
When a host memory page is mapped as both Executable and Writable, the MMU internally marks it as an External Alias. If BasicBlocks have already been pre-decoded and cached on this page, the MMU tags the write permission for this page with a ForceWriteSlow flag. Any subsequent write to this page will miss the fast TLB, hit ForceWriteSlow, and be forced into a slow path. The slow path calls invalidate_code_cache_page(addr), invalidating all BasicBlocks associated with that page.
Execution-time race: Merely invalidating the block cache on write is not enough — if the current EIP happens to fall on the page being written, the tail-call jump to the next instruction may already have been overwritten. For this, I implemented ShouldInterceptExecWriteForSmc: once it detects that the page containing the current EIP is being modified, it immediately yields and switches to a single-instruction safe mode (max_insts = 1), guaranteeing a clear instruction boundary between the write operation and the jump to new code, preventing races.
Multi-Engine TLB Consistency: clone(CLONE_VM) creates new threads that share the same MmuCore, but each Engine has its own SoftTLB. For this, I implemented a RuntimeTlbShootdownRing (1024-slot ring buffer): the party that changed the page table writes the flushed guest page into the ring, and other Engines consume from this ring and flush their local TLBs before their next execution.
This mechanism allows LuaJIT’s -joff mode to run stably and even lets Node.js/V8 start up. Occasional crashes remain a known limitation, likely due to subtle bugs in my instruction set implementation or incomplete Linux syscalls.
SMC Mechanics in Detail
The overview above covers the high-level idea, but if you’re building something similar, the details below are worth reading. The core philosophy is to push all detection costs into the MMU permission bits, avoiding global write monitoring or disassembly scans.
External Alias Tracking. MmuCore maintains an external_aliases map internally (key is the host page pointer; value contains exec_count, write_count, and the set of associated guest pages). When the C# layer maps a host page as External + Write + Exec via mmap, that page gets registered in this table. This table is only updated on page-table changes (mmap/mprotect/munmap); the hot path never touches it.
Lazy Arming of ForceWriteSlow. What actually determines whether an external page needs SMC detection is not whether it has Exec permission, but whether there are cached BasicBlocks on it. refresh_smc_armed_for_host_page() is called in two situations:
- A new block has been decoded, and we need to check if any of the host pages it covers have writable external mappings;
- An external mapping is established or modified (e.g.,
mprotectaddsPROT_WRITE).
If (exec_count > 0) && (there is a live block on this host page), all guest page entries for this page are tagged with ForceWriteSlow. This bit is a runtime temporary mark; it is not persisted, not copied by fork, and does not appear in deep copies of the page table.
Write-path Interception Chain. When the guest executes a write instruction:
write() -> MicroTLB miss -> SoftTLB miss -> resolve_slow()
  -> look up page directory -> find ForceWriteSlow in permissions
  -> call invalidate_code_cache_page(guest_addr)
  -> mark all BasicBlocks on the associated host page as invalid
  -> continue with the actual memory write
invalidate_code_cache_page does not traverse the entire block cache. Instead, it uses a page_to_blocks reverse index (host page → block list) to achieve O(number of affected blocks) local invalidation. Blocks marked invalid are automatically re-decoded the next time X86_Run tries to enter them.
Execution-time Race: Old Code Currently Running vs. New Code Just Written. Merely invalidating the block cache on write is not enough — if the current EIP happens to fall on the page being written, the tail-call jump to the next instruction may already have been overwritten. For this, mmu_impl.h has ShouldInterceptExecWriteForSmc:
if (state->intercept_exec_write_for_smc && !state->allow_write_exec_page) {
    uint32_t current_page = state->ctx.eip >> 12;
    uint32_t target_page  = addr >> 12;
    if (target_page == current_page || target_page == current_page + 1)
        return true;  // trigger SMC yield
}
Once this condition hits, the write does not execute immediately. Instead, state->smc_write_to_exec is set, and the current handler returns a special yield flow. When X86_Run’s main loop detects smc_write_to_exec, it enters single-instruction safe mode:
- Set
allow_write_exec_page = true, allowing exactly one guest instruction to write to an executable page; - Decode and execute only a single-instruction block for the current EIP (
max_insts = 1); - Immediately clear
allow_write_exec_pageafter execution, restoring the interception state.
This guarantees a clear instruction boundary between the write operation and the jump to new code, preventing races.
TLB Consistency Under Multi-Engine Sharing. When clone(CLONE_VM) creates a new thread, multiple Engines share the same MmuCore, but each Engine has its own SoftTLB and block_lookup_cache. Engine A’s invalidate_code_cache_page does not automatically flush Engine B’s local TLB. For this, MmuCore has a RuntimeTlbShootdownRing (1024-slot ring buffer):
- The party that changed the page table writes the flushed guest page into the ring;
- Other Engines call
sync_runtime_tlb_shootdowns()the next time they enterX86_Run, consuming new entries in the ring and flushing their local TLBs.
This ring’s capacity is large enough to cover the vast majority of single mprotect/munmap page ranges; if it overflows, a full flush is issued directly.
A Failed Experiment with Copy-and-Patch JIT
The concept of a Copy-and-Patch JIT is beautifully simple: pre-compile opcode handlers into binary stencils, and at runtime, just copy the template and patch in the constants/addresses. Theoretically it bypasses the complexity of a full backend, register allocation, and traditional machine-code generation (see paper: Copy-and-Patch Compilation).
Since I was already using preserve_none + [[musttail]] to push interpreter hot paths incredibly low, I tried turning handlers into stencils, patching operands, and stringing them together into machine code. I was hoping for a 200%+ performance boost. It was actually slightly slower than my interpreter.
The reason: my direct-threaded interpreter had already pushed dispatch overhead incredibly low. The real bottlenecks were memory access, address translation, state maintenance, and I-Cache pressure. By generating stencils, I eliminated some bytecode reading, but the resulting code bloat absolutely wrecked the I-Cache.
It was a humbling lesson: a poorly fitted JIT is just garbage, and loading immediates isn’t necessarily faster than reading bytecode if your cache is thrashing.
This forced me to profile more carefully:
- Once a direct-threaded interpreter has pushed dispatch cost low, the bottleneck may no longer be dispatch
- For this design, memory access and address translation are more expensive than I expected
- A bad JIT is garbage: I-Cache pressure increases, and loading immediates is not necessarily faster than loading bytecode
Threading Model
flowchart TB
    subgraph Scheduler["KernelScheduler (1 Host Thread)"]
        S["Scheduler Loop"]
    end

    subgraph TaskA["FiberTask A"]
        A1["Engine A"]
        A2["SoftTLB A"]
        A3["block_lookup_cache A"]
    end

    subgraph TaskB["FiberTask B"]
        B1["Engine B"]
        B2["SoftTLB B"]
        B3["block_lookup_cache B"]
    end

    subgraph Shared["Shared (Atomic RC)"]
        M["MmuCore"]
        R["RuntimeTlbShootdownRing"]
    end

    S -->|"yield / switch"| A1
    S -->|"yield / switch"| B1
    A1 --> M
    B1 --> M
    M --> R
%%endmermaid
I implemented clone/fork/vfork and basic pthread semantics, but the concurrency model is not OS-level multi-threaded parallelism:
KernelScheduleris bound to a fixed host thread. AllFiberTaskcreation, switching, syscall dispatch, and signal delivery happen sequentially on this thread.- Each
FiberTaskowns its ownEngineinstance, so the interpreter core itself does not need thread-safety design. clone(CLONE_VM | CLONE_THREAD)creates new threads that share the sameMmuCore(lifetime managed by atomic reference counting).- Sharing
MmuCoreintroduces a problem: when Engine A modifies the page table or flushes the block cache, Engine B’sSoftTLBandblock_lookup_cacheare still stale. I implemented a lightweightRuntimeTlbShootdownRingfor this: the party that changed the page table writes the affected guest page into a ring buffer, and other Engines consume from this ring and flush their local TLBs before their next execution.
The ceiling of this design is that multiple guest threads are serialized at the host level and cannot leverage multi-core parallelism. For shells, Python, and compilation tasks inside the container, this is usually enough; but if the guest runs heavily parallel scientific computing, performance will be noticeably limited.
Linux Compatibility Layer & Usability
Beyond the CPU core, the project also implements a Linux compatibility environment, including:
- Linux-like
fork/vfork/clone/execve/wait*semantics tmpfs/procfs/ host mounts / overlay roots- PTY / TTY
- Sockets and native netstack integration
- OCI image pull/save/load/import/export
- Container-style execution via
Podish.Cli
This layer is what determines whether the project can move from benchmarks to real-world workloads.
| Category | Example / Evidence | Current Status | Main Limitation |
|---|---|---|---|
| Shell | /bin/sh -lc true | Verified | Currently covers shell startup and short commands |
| Coreutils / Archive | grep -R / tar cf / tar xf | Verified | |
| Scripting | python (primes.py) | Verified | Workload currently has only a few samples; easily affected by phone temperature |
| JIT-heavy | LuaJIT (primes_jit.lua) | Verified | Results were once polluted by a notify-socket / network-path bug, now fixed |
| Build-oriented mixed workload | make compile on CoreMark tree | Verified | Current main table uses a compile-only metric |
| Network / tooling compat | git clone | Compatibility verified | High network variance |
Graphics & Audio: Experimental Wayland and PulseAudio Support
The codebase already has two experimental multimedia pipelines, but they haven’t matured enough for daily testing:
Podish.Wayland(~7K lines of C#): Implements a lightweight Wayland compositor core that bridges guest Wayland client protocols to host SDL windows. The graphics path currently only supports sending Wayland surfaces via shmem; it does not support gbm/EGL.footworks, but SDL2 does not — apparently SDL2 on Wayland requires EGL.Podish.Pulse(~6K lines of C#): Implements PulseAudio protocol client/server sides, redirecting guest audio streams to the host audio backend.ffplay -nodispcan play music.
These two features are currently macOS only; iOS / Web adaptations have not been done yet.
Performance Data & Optimization Journey
The Journey from 600 to 3000
| Phase | Key Change | CoreMark | Notes |
|---|---|---|---|
| Initial | Baseline interpreter | ~600 | ABI / TLB design was in place, but a TLB bug ruined the hot path |
| Bugfix | Fixed address translation | ~800 | Confirmed address translation was the biggest issue |
| Hot Path | PC / block budget / template specialization | ~1500 | Stopped writing redundant state to memory |
| Memory | Data layout / paired loads | ~2000 | Shifted focus from dispatch to memory access |
| Lazy Flags | Static pruning + PF lazy | ~2200 | Full lazy flags trial was slower; chose the middle ground |
| Linking | Append simple successor blocks | ~2500 | Lowered block boundary costs |
| Superops | Profile-guided fused ops | ~3000 | ~256 anchor + RAW superopcodes stabilized at ~3000 |
Key takeaways:
- As optimization progresses, bottlenecks shift rapidly
- Text-book solutions don’t always fit specific constraints
- A well-designed interpreter can outperform a poorly fitted baseline JIT
Full Benchmarks
Testing environment:
- Podish / QEMU desktop data:
MacBook Pro (Apple M3 Max, macOS 26.3) - iSH data:
iPhone 17standard edition (A19),Alpine Linux v3.14.3 - Podish / QEMU guest:
docker.io/i386/alpine:latest - Native host reference: same
MacBook Pro (Apple M3 Max, macOS 26.3)
Startup & Compute Intensive:
| Workload | Podish(A19) | Podish(M3) | iSH (A19) | Podman i386 (QEMU JIT) | QEMU TCI | Native (M3) | Notes |
|---|---|---|---|---|---|---|---|
sh -lc true warm start | 20 ms | 20 ms | 30 ms | 30 ms | 30 ms | 10 ms | End-to-end startup cost; Podish uses Podish.Cli run; QEMU uses explicit qemu-i386 -L <rootfs> |
| CoreMark 1.0 | 3447 | 2967 | 1692 | 11456 | 325 | 38087 | |
python primes.py | 78.3 s | 89.4 s | 684.4 s | 40.9 s | 787.3 s | 1.8 s | Scripting benchmark from kostya/benchmarks |
luajit primes | 3.1 s | 4.0 s | 46.6 s | 1.7 s | 39.3 s | 0.2 s | |
luajit -joff | 14.5 s | 17.3 s | 27.5 s | 7.1 s | 152.7 s | 0.7 s |
File I/O & Mixed Workloads:
| Workload | Podish(A19) | Podish(M3) | iSH (A19) | Podman i386 (QEMU JIT) | Native (M3, arm64) | Notes |
|---|---|---|---|---|---|---|
grep -R on CoreMark tree | 50 ms | 50 ms | 70 ms | 70 ms | 10 ms | Excluding .git, GNU grep |
tar cf CoreMark tree | 40 ms | 30 ms | 40 ms | 97 ms | 10 ms | GNU tar |
tar xf CoreMark tree | 250 ms | 250 ms | 170 ms | 161 ms | 30 ms | GNU tar |
make compile on CoreMark tree | 9470 ms | 10460 ms | 11430 ms | 7330 ms | 210 ms | make compile; native is single-process make -j1 compile CC=clang |
git clone CoreMark | 3230 ms | 3300 ms | 5190 ms | 2660 ms | 2980 ms | Compatibility verification only; high network variance |
Both tables above, except where explicitly noted, are medians of 5 runs. QEMU TCI is omitted from the File I/O table (too slow to be meaningful here).
Two “Counter-Intuitive” Data Points
Why is the A19 faster than the M3 Max?
In this specific project, the interpreter is entirely bound by single-thread IPC and memory latency. It can’t leverage the M3 Max’s massive multi-core architecture or 300GB/s bandwidth. CoreMark fits easily in the cache, so the A19’s slight lead is just a reflection of architectural generation differences in single-core latency.
luajit -joff is faster than the JIT on iSH
On iSH, luajit -joff running primes_jit.lua took 27530 ms, while JIT mode took 46650 ms. Theories:
- iSH’s SMC handling path is very heavy. LuaJIT’s constant code generation causes iSH to continually flush and re-translate its code cache.
- In
-joffmode, no machine code is written, SMC traps are avoided, and it runs smoother. - Another possibility is extra TLB / page-table walk overhead on iSH’s write-protected pages used for SMC detection.
I haven’t deeply studied iSH’s internal implementation; the above is speculation. If you’re familiar with iSH’s source, I’d love to hear the real cause in the comments.
Comparison with Wasm3
As another pure-interpreter reference, I ran wasm3 coremark.wasm five times on the same MacBook:
- 1st run:
Iterations = 60000,CoreMark = 3308 - Next 4 runs stabilized at
Iterations = 40000, median ≈3229
In other words, Podish’s pure compute performance is already competitive with Wasm3.
Conclusion
Podish proves one thing: on platforms where JIT is forbidden, a carefully designed, profiled, and hardware-aware interpreter can achieve surprising performance. It’s not a silver bullet — complex applications like Node.js still have significant bottlenecks, and multi-threading cannot leverage multiple cores — but for command-line tools, scripting runtimes, and lightweight compilation tasks, it is already a usable daily tool.
If you’re interested in the project, check out the source on GitHub or try the Podish Web Demo directly in your browser.